

Ever feel like your graphics card might be holding you back? Running a benchmark test shows you exactly how your GPU (graphics processing unit) performs under load. This guide walks you through the steps to check its stability, heat, and energy use. You'll learn how to update your drivers, use tools like GPU-Z (a free tool that displays your GPU details), and run tests that catch problems early. Follow these clear steps to decide if your graphics card is ready for action or if it needs an upgrade.
GPU Benchmarking Quick-Start: A Step-by-Step Guide
This guide walks you through a simple process to check your graphics card’s performance. We run tests that measure stability, heat (core temperature), and overall efficiency with trusted tools. Follow these steps to see if your GPU is working well or if it might need an upgrade after long-term use.
- Update your GPU drivers so you get the latest fixes and performance boosts.
- Install a monitoring tool like GPU-Z to view real-time temperature, clock speeds, and fan activity.
- Pick a benchmark tool. For instance, 3DMark Time Spy gives synthetic scores that help predict how your games will run.
- Run a baseline test at a fixed resolution using preset profiles to gather steady data.
- Do a stress and heat test that pushes your graphics card to its limit. This will reveal any issues with overheating or stability.
- Write down your scores and compare them to known benchmarks. This helps spot any problems and gives you a clear picture of overall performance.
Make sure you allow the system to cool completely between tests. Taking breaks helps prevent overheating and shows gradual changes in performance, especially after major hardware tweaks or overclock adjustments.
Preparing Your System for Reliable GPU Benchmarking
Before you run any tests, check that your system’s power supply and case airflow are up to the job. Make sure your power supply provides enough wattage for your GPU and that the case fans push air well around all the parts. Good airflow stops heat from building up and helps keep your results steady over time.
Update your GPU drivers and adjust your Windows settings next. Old drivers can slow things down and hide your true performance. Head over to your GPU maker’s website to download the latest driver. Then, set your Windows power plan to high performance. This setting turns off energy-saving features that might slow your GPU on purpose.
Once your drivers are updated, install a tool like GPU-Z to check how your GPU is doing. This tool shows you real-time details like temperatures, clock speeds, and load. If you see temperatures over 84°C with the standard cooler, it might be a sign that your airflow isn’t enough. You can also recalibrate the sensors to make sure you get accurate readings.
Lastly, close any programs running in the background so they don’t mess with your test results.
Selecting GPU Benchmark Software for Accurate Metrics
Testing your graphics card in real-world conditions starts with picking the right benchmark tool. You need tools that push your GPU to its limits or mimic the scenes you see in games. Decide what matters most to you: stability, temperature, or overall performance under heavy load.
| Tool Name | Primary Use | Key Feature |
|---|---|---|
| FurMark | Thermal stress testing | Drives your GPU to high temperatures to spot overheating problems |
| 3DMark | Synthetic performance | Uses tests like Time Spy to give you a score that hints at gaming performance |
| Heaven | Real-world scene rendering | Runs detailed DirectX and OpenGL tests for lifelike visuals |
| MSI Kombustor | Combined GPU and CPU stress | Built on the FurMark engine with extra tweaks for MSI hardware |
| OCCT | Multi-component stress testing | Checks your GPU along with your CPU, RAM, and power supply under heavy loads |
| PassMark | 2D and 3D evaluation | Compares your card’s performance with a large database of systems |
Using these benchmarking tools along with a real-time monitoring utility like GPU-Z makes testing even clearer. For example, run FurMark or MSI Kombustor to check how hot your card gets, and then review GPU-Z logs to see if it is slowing down (throttling) because of the heat. This layered method shows you where your GPU is strong and where it might need a tune-up, especially after overclocking or other tweaks.
By combining a stress test with live monitoring, you get a trustworthy picture of your GPU’s performance while catching problems before they become serious. Keeping an eye on these details is key to safe and effective GPU benchmarking.
Executing Baseline and Stress Tests for GPU Benchmarking
Baseline performance testing
Start by setting your display to a common resolution like 1080p or 1440p. Pick a preset in a testing tool such as 3DMark Time Spy. For example, run a 1080p test with medium details, then write down the score. Save your detailed logs so you can check later if things have changed. Also, run GPU-Z to note the starting temperatures and clock speeds.
Stress and stability analysis
Next, use a tool like FurMark to slowly increase the workload on your GPU until it nears its limits. Keep an eye on the temperature and clock speed. Write down any issues like slowdowns or flickering images. If your GPU starts to throttle because it gets too hot, record the temperature for later use. After any overclocking or hardware tweaks, run these tests again to make sure the card is still stable.
Analyzing GPU Benchmark Scores and Metrics
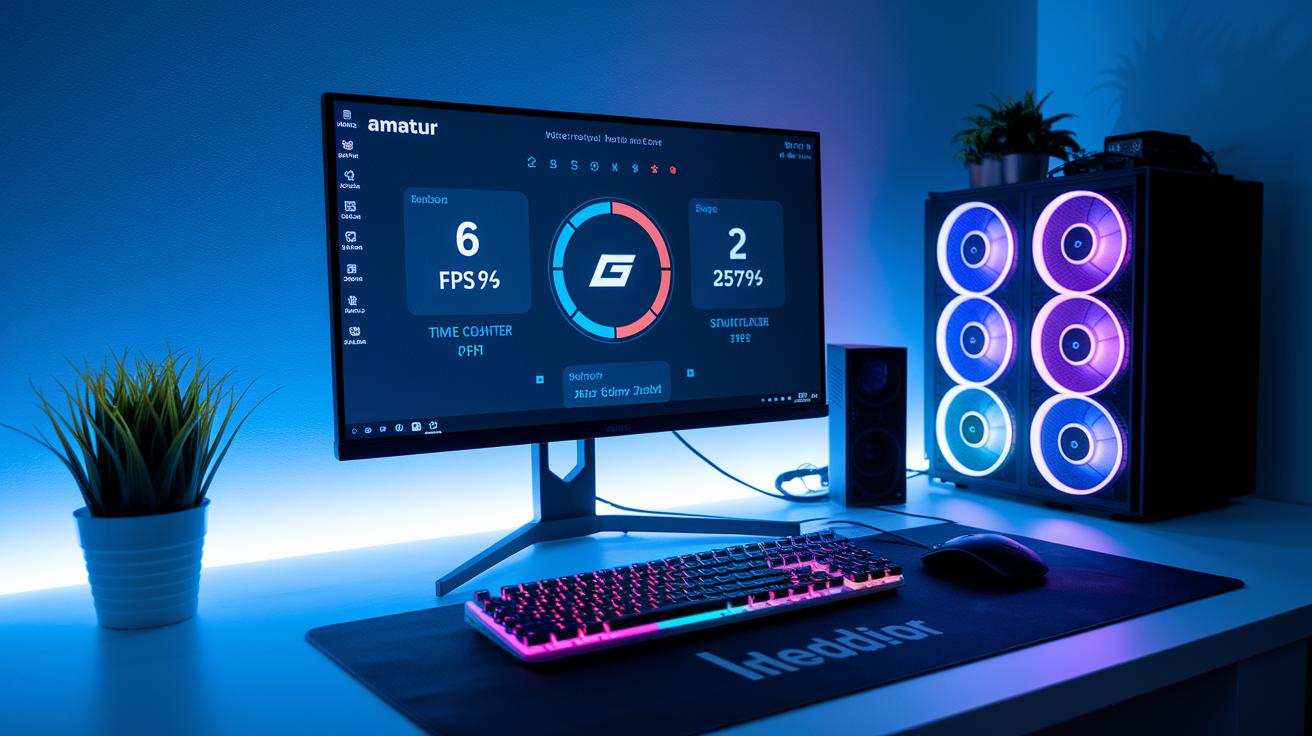
GPU tests usually check FPS (frames per second) and synthetic scores. FPS shows how many images your GPU produces each second, so higher numbers mean smoother play. Synthetic tests like Time Spy mimic real gaming by running heavy graphics tasks. For example, an 8500 Time Spy score often means the card can handle 1080p gaming well. Tools like GPU-Z also track peak load and temperature so you get more than just one number.
To compare results fairly, run tests at different resolutions and settings. Then, plot the scores side by side in a graph to see how performance scales. For instance, one GPU might drop less than 10% in score when moving from 1080p to 1440p, showing strong scaling. This method helps you see which cards hold steady under more stress.
It’s also important to check how well synthetic tests match real gaming. Compare the expected FPS from tools to what you record during play. Small differences are normal, but big gaps may point to issues like overheating (thermal throttling means the GPU slows down to protect itself). Consistent results mean the GPU is running right, while erratic numbers could mean you need to look at your cooling or drivers.
Troubleshooting GPU Benchmark Challenges and Optimizations
If you notice flickering images or odd visuals during a GPU test, the drivers might be at fault. Outdated or mismatched drivers can lead to unstable performance. For example, if you see a buggy image during a stress test, it might be a clear sign of driver issues. Tools like GPU-Z help track power draw and fan speed; a sudden power spike often points to a hardware fault.
Cooling is another key area to check. When you see aggressive fan activity and temperatures in the high 80s, your card is likely struggling with airflow. Try adjusting your case fans or repositioning them to improve airflow. You can also change the GPU fan curves, setting the fans to ramp up once the temperature hits 70°C might keep temps in check during heavy benchmarks.
Tuning power limits and undervolt profiles can further stabilize your GPU. Lowering the voltage a bit can ease strain without sacrificing speed. After each adjustment, re-run tests to see if performance improves. A systematic approach, updating drivers, checking cooling, and tweaking power settings, usually helps reveal the root cause of odd benchmark scores.
Make small, careful changes and note the results. Each gentle tweak builds confidence and steady performance over time.
Advanced GPU Benchmarking: Custom Scenarios and Overclocking
Start by configuring your tests with custom resolutions and specific API settings. Testing at 1440p or Ultra-HD can reveal memory bandwidth limits that lower resolutions might hide. For example, you might run one test at 1440p using DirectX 12 and another with Ultra-HD settings using a different API. This method helps you spot performance changes when the GPU is under heavier loads.
Next, try gradual overclock testing. Increase your core clock speed in 25 MHz steps while checking stability and performance differences. After each step, run your benchmark and record details like FPS, temperature, and clock speed. Suppose your GPU normally runs at 1500 MHz; increasing it to 1525 MHz lets you see if scores like those from Time Spy improve or if temperatures climb. Keep detailed notes for a clear side-by-side comparison. Small adjustments ensure you don’t push the GPU beyond its safe limits.
Automate your tests using scripts or command-line tools when you can. This not only reduces human error but also lets you run multiple scenarios smoothly. For instance, a script can gradually boost the clock speed while logging results, giving you a precise view of where your GPU stays stable.
Finally, validate your lab results with VR and real-world game tests. Run VRMark for VR workloads and use automated in-game benchmarks that mimic actual play. The goal is to see if the gains from synthetic tests translate to everyday use. Combining controlled tests with real-world trials builds confidence in your overclocking settings and custom profiles.
Final Words
In the action, we reviewed the full GPU benchmarking process. We started with driver updates and monitoring setup, ran baseline and stress tests, and compared scores with known data.
We then covered system preparation, accurate test execution, and troubleshooting tips. You now have a clear roadmap on how to benchmark gpu, from simple run-throughs to custom overclocking scenarios.
This guide helps you make smart, informed decisions for your setup. Enjoy testing and optimizing your graphics card!
FAQ
How to benchmark GPU Reddit
The question about benchmarking a GPU on Reddit suggests using community-recommended tools like 3DMark or FurMark. Users share settings and tips to measure performance and thermals, offering practical, real-world insights.
3DMark
The term 3DMark refers to a popular benchmarking tool that stresses your GPU with graphics-heavy tests. It measures gaming performance by producing scores that reflect how well your card handles visual loads.
How to benchmark GPU for gaming
Evaluating a GPU for gaming means running in-game benchmarks or synthetic tests like 3DMark to simulate gaming loads. This process reveals how well the GPU manages graphics details, frame rates, and overall gameplay smoothness.
How to benchmark GPU with MSI Afterburner
Benchmarking a GPU with MSI Afterburner involves running a performance test while using the tool to monitor temperatures, clock speeds, and load in real time. This dual approach helps verify stability and potential throttle points.
How to benchmark GPU free
Benchmarking a GPU for free means using no-cost tools such as Unigine Heaven or PassMark PerformanceTest’s free version. These applications deliver baseline and stress tests that yield helpful performance scores without a fee.
Heaven Benchmark
The Heaven Benchmark refers to a testing tool that uses high-detail scenes to stress your GPU’s DirectX/OpenGL capabilities. It is great for assessing visual performance and thermal behavior under heavy graphical loads.
How to benchmark GPU on Cinebench
Although Cinebench is primarily known for CPU tests, benchmarking a GPU on Cinebench means using its graphics rendering functions when available. It helps gauge your GPU’s ability to manage rendering tasks in a controlled environment.
GPU benchmark software
GPU benchmark software includes tools like 3DMark, FurMark, Unigine Heaven, and PCMark. Each offers tests to measure graphics performance, thermal limits, and stability under load, giving clear, comparative performance data.
How to check GPU benchmarks
Checking GPU benchmarks means running a selected benchmark test and reviewing the score reports and logs produced. These results let you compare your GPU’s performance against typical standards for similar hardware.
Can you benchmark a GPU
Benchmarking a GPU is entirely possible by running standardized tests that assess performance, temperatures, and power draw. Tools like 3DMark and FurMark help ensure your card meets requirements for gaming or creative work.
Is 98% GPU normal
Interpreting 98% GPU usage means that your graphics card is nearly maxed out under heavy load, such as during gaming or rendering. It’s common during intense tasks, but keep an eye on temperature levels for safety.
How to evaluate GPU performance
Evaluating GPU performance means running both baseline and stress tests to collect metrics like FPS, temperature, and power draw. Comparing these scores with reference data helps determine if your GPU maintains efficiency and stability.