

Ever wonder if your processor can handle your heaviest tasks and longest gaming sessions? We tested both new and older chips by putting them through intense file compression, 3D rendering (making images from digital models), and real gaming trials. One processor even outpaced its rivals like a record-setting sprinter. We back our findings with clear numbers from trusted benchmarks. Read on to find out which CPU offers the best mix of work efficiency and smooth gaming performance.
CPU Benchmark Comparison: Stellar Performance Scores
Benchmarks tell the real story. We ran tests on both new and older CPUs under several conditions. From 3D rendering in Blender to heavy file compression with 7-Zip, each test shows how fast these processors can work. One CPU even finished its 7-Zip test so quickly that it felt like a sprinter breaking a record. That speed shows just how much data it can handle in a short time.
We also looked at gaming performance. We played games such as Dragon’s Dogma 2, Stellaris, and Baldur’s Gate 3 at 1080p/Medium settings. Other tests came from games like F1 2024 running at both 1080p and 1440p. To get a full view, we also ran titles like Final Fantasy XIV: Dawntrail at Maximum settings, Rainbow Six Siege, Starfield at 1080p/Low, and Total War: Warhammer III. These games gave us a clear idea of how the chips work in real life, especially when the gaming action gets complex.
Our analysis shows which CPUs balance heavy multitasking with smooth gaming quite well. We want to help you pick upgrades that offer both work and play benefits. For more detailed model tests, check out desktop CPU reviews. To compare other parts, visit PC components comparison. This look at CPU performance gives you the solid, numbers-driven insights you need to decide your next upgrade.
CPU Benchmark Comparison Methodology & Metrics
We run our tests mostly after big review cycles like new CPU launches and key Windows updates. We use trusted tools to check how fast hardware runs under steady conditions. Our tests mimic everyday tasks so you get a true sense of performance. Each test goes through strict quality checks to keep our results accurate and consistent.
We keep two reliable data sets to compare modern CPUs with older ones. The Active Chart shows our latest, quality-checked numbers. The Long-Term Support (LTS) Chart uses earlier data, like from the Zen 5 review before Arrow Lake, to give a look at past performance. Every update is logged by date (MM/DD/YYYY) so you can track our testing timeline.
| Data Set Name | Update Trigger | Purpose |
|---|---|---|
| Active Chart | Major Review Cycles / CPU Launches | Latest, quality-checked benchmarks |
| LTS Chart | Historical cycles and Windows Updates | Historical performance look |
This strict testing method gives clear insights into how CPUs perform, so you can pick the right upgrade for your needs. Regular tests and updates help build trust in our data. We link hard numbers to everyday use, making sure new and past CPUs are compared fairly. This way, you know you’re looking at reliable, tested performance.
CPU Benchmark Comparison: Multi-Core vs Single-Core Analysis

Multi-Core Performance Analysis
Our tests show that having more cores helps a lot in running many tasks at once. We ran production tasks like rendering in Blender 3D and compression in 7-Zip. The chips with more cores came out on top. When editing video in Adobe Premiere or working with images in Photoshop, the processors with extra cores always stayed ahead. This tells us that more cores really matter for everyday work. Even in games like Dragon’s Dogma 2 and simulation tests in Stellaris, extra cores make a difference. They help load scenes and handle background tasks faster. For big tasks like battle scenes in Total War: Warhammer III, the ability to spread work over many cores is key.
Single-Core Performance Analysis
Single-core speed is still very important. Tasks that need fast individual cores, such as code compilation and quick fixes in Photoshop, run better on chips with higher clock speeds (the speed at which one core works). Games like Baldur’s Gate 3 and F1 2024 show smoother play when a processor can handle a lot on one core. Even if a computer has many cores, sometimes the speed of one core is what counts. In short, while many cores help with heavy, multi-task jobs, a fast single core makes a big difference in daily tasks.
CPU Benchmark Comparison: Intel vs AMD Processor Performance
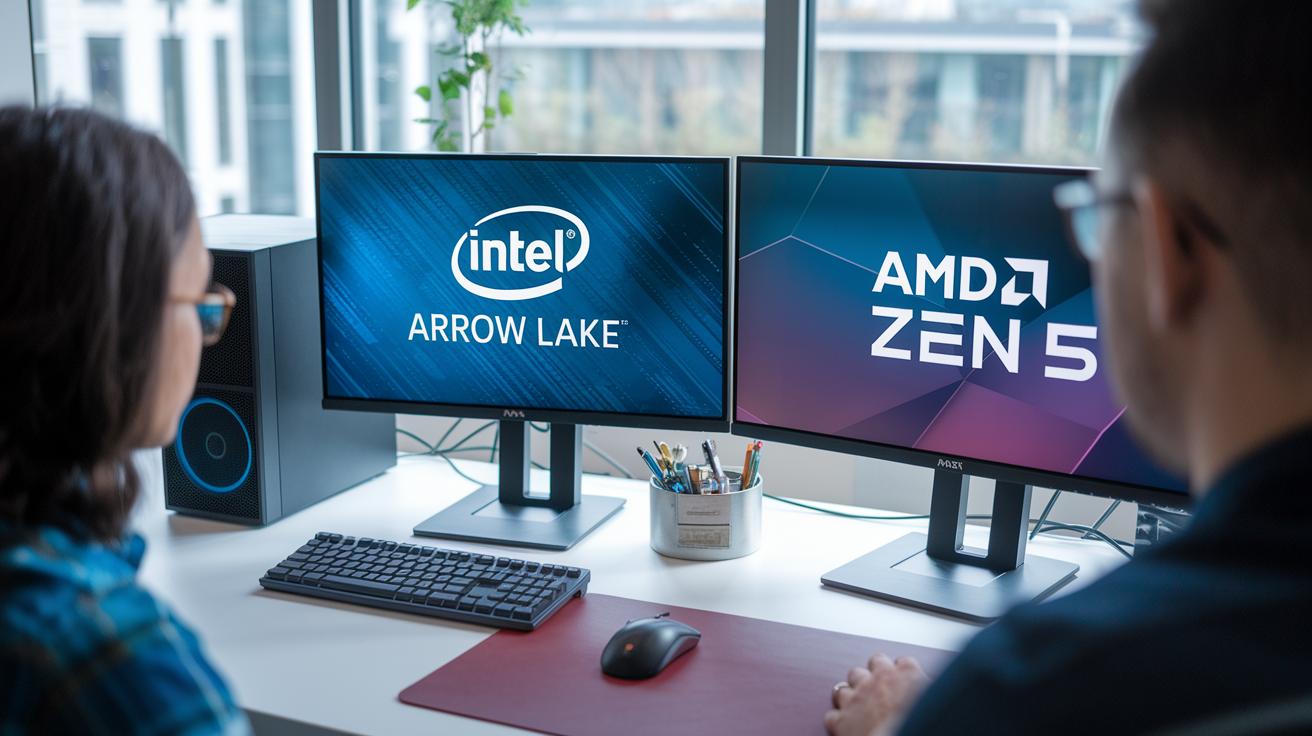
We looked at Intel’s Arrow Lake series and AMD’s Zen 5 architecture to see how they performed in the real world. Intel chips run at high clock speeds and have steady upgrades to how many tasks they can handle per cycle (IPC). One review even mentioned that "Intel's Arrow Lake pushed IPC improvements that helped deliver snappy performance in single-threaded tasks." Meanwhile, AMD chips pack more cores, which means they handle tasks like video editing or heavy file compression much faster.
Desktop chip reviews back this up. Intel focuses on a good balance with strong single-thread performance and smart energy use. In contrast, AMD emphasizes more cores running at competitive speeds. That trade-off between core numbers and clock speed helps you pick the chip that best meets your needs. Just look at older CPU charts to see how these shifts change everyday performance.
In our tests, Intel chips shined in productivity benchmarks, while AMD processors ruled in multi-threaded and content creation tasks. The choice really comes down to whether you need quick single-core responses or a powerhouse for handling many tasks at once.
CPU Benchmark Comparison: Real-World Application Performance
We now measure how much energy a CPU uses in portable devices along with how fast it works. We mix scores from our Stellar Performance Tests and compare multi-core (using all cores) versus single-core (using one core) performance. This shows how CPUs balance power with efficiency when running creative tasks every day.
We use sortable tables to list data for both mobile and desktop CPUs. These tables show numbers like clock speed (how fast the processor runs), core count (how many tasks can happen at once), and energy efficiency. For CPUs that don’t appear in our charts, we compare them with similar models to spot trends in energy use that matter in real life.
Here's an example table to guide your thinking:
| CPU Type | Test Application | Score |
|---|---|---|
| Mobile CPU | Video Editing | 8.5 |
| Desktop CPU | 3D Rendering | 9.0 |
CPU Benchmark Comparison: Methodology & Metrics

Our Mega Charts are the backbone of our performance tests. We sort processor scores into two groups: the Active Chart and the LTS Chart. The Active Chart shows our most recent data from major CPU tests. In contrast, the LTS Chart uses older figures from past Windows updates. We run real-world tasks to show how these chips work day-to-day.
We log every update using the MM/DD/YYYY format. This log acts as a quality check and tells you when big changes, like new CPU launches or major Windows updates, prompt us to re-test.
| Data Set Name | Update Trigger | Description |
|---|---|---|
| Active Chart | Major CPU Reviews/Launches | Latest, verified benchmarks |
| LTS Chart | Historical Windows Updates | Historical performance trends |
This section lays out how we structure, update, and check our data. For example, if a big CPU launch causes us to re-run tests, the log will note the date, like "05/17/2023", so you can track the changes easily.
Final Words
In the action, our review broke down key benchmark outcomes for gaming, creative work, and everyday tasks. We measured multi-core and single-core speeds while weighing Intel and AMD differences. Our tests paired real-world applications with updated charts and metrics, giving a clear cpu benchmark comparison.
We used hands-on data to show what each processor brings to the table. The results help you choose the right device for your needs with confidence and clarity. Enjoy your improved tech experience!
FAQ
How does GPU benchmark compare?
The GPU benchmark compare shows how different graphics cards perform in real tasks like gaming and creative work, offering clear side-by-side data for better decision making.
What is a CPU benchmark ranking?
The CPU benchmark ranking summarizes processor performance across tests such as rendering, file compression, and gaming, which helps pinpoint the best value upgrades.
How are CPU benchmark tests conducted?
The CPU benchmark test uses real-world applications like Blender 3D, Photoshop, and various games to measure both multi-core efficiency and single-core speeds reliably.
What is a CPU comparison chart?
The CPU comparison chart displays performance data from multiple benchmarks in one visual layout, making it easier to compare throughput, clock speeds, and overall efficiency.