
Ever wondered if your CPU is truly reaching its potential? CPU-Z Benchmark tests give you clear numbers on how well your processor handles simple tasks and multitasking. It works like a report card that highlights both strengths and areas to improve. In this guide, we explain how to run the tests, compare the scores, and boost your CPU's performance to get more out of your system.
Running CPU-Z Benchmark Tests
When you first start CPU-Z, it checks your computer parts to be sure they're good to go. When the tool asks for PC validation, it sends your hardware details and clock speeds to an anonymous online record. Think of it as keeping a receipt for your PC parts, so you have a baseline for future tests.
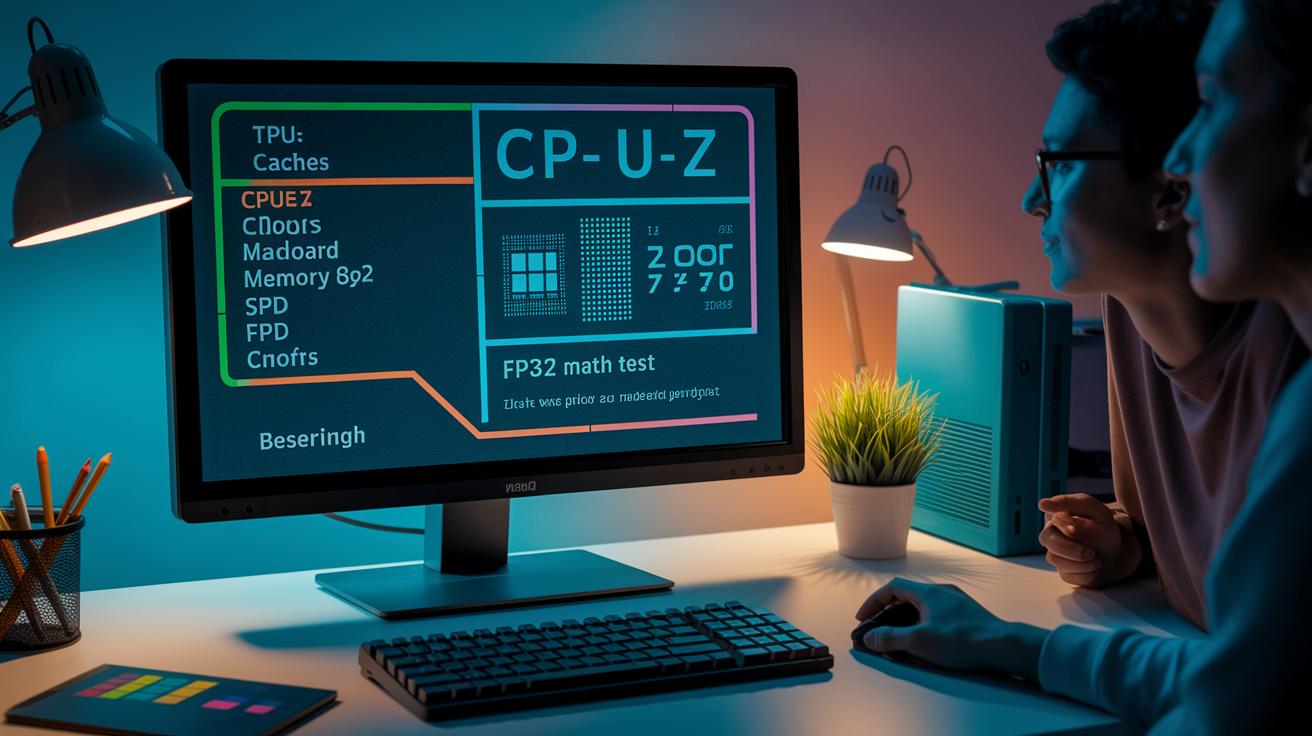
CPU-Z looks a bit like the old Windows 95 design. Each tab gives a clear look at a part of your system: CPU, Caches, Mainboard, Memory, SPD, and Graphics. But the Bench tab really stands out. Here, you can run tests that check both single-core and multi-core performance with an FP32 math test (a test that measures your processor's math skills). The simple layout means you see the numbers without extra clutter.
- Visit the CPUID website and download the latest CPU-Z installer.
- Run the installer and open CPU-Z as an administrator.
- Follow the on-screen prompt to record your hardware details.
- Switch to the Bench tab and pick either a Single-Core or Multi-Core test.
- Click Run and wait for the FP32 math test to complete.
- Press Submit to upload your scores for community comparison.
Uploading your scores lets you compare your results with others in the community. This extra step shows you exactly how your CPU performs against similar setups, whether you're gaming or working. It's a straightforward way to collect clear, repeatable numbers that you can trust.
cpu z benchmark: Boost Your CPU Score
CPU-Z gives you two scores: one for a single core and one for all cores together. The single-core score comes from a test that checks floating point math (like adds, multiplies, conversions, and compares) on one core. The multi-core score adds up the work of all cores running at the same time. This helps you see if your system is built for quick, one-at-a-time tasks or if it handles many tasks at once.
A higher score means your CPU processes tasks more efficiently. Newer chips usually show steady improvements, while older designs, such as Bulldozer, can score well below what they could theoretically achieve.
| Metric | What it measures | Typical range |
|---|---|---|
| Single-Core Score | Performance on one core’s FP32 test | 500–4000 |
| Multi-Core Score | Total performance across all cores | 2000–20000+ |
| FP32 Math Throughput | Floating-point operations per second | 1–10 Gops |
When you check your scores, compare them to published benchmarks for similar CPUs. This helps you know if your system is tuned for the job. Use these numbers as a guide to boost your performance for everyday tasks and multi-threaded work.
CPU-Z Benchmark Methodology and Criteria

We use a test that runs FP32 math with SSE instructions. FP32 means single precision floating point, and SSE instructions handle basic data tasks. The test mainly looks at simple math tasks like adding, multiplying, converting, and comparing. It does check some 128-bit memory access but does not take full advantage of vector math. In short, it shows how well a CPU handles basic floating point math.
This test is a moderate IPC test (IPC stands for instructions per cycle). Most CPUs run at under half of their full potential in this test. The small set of instructions benefits from the on-die micro-op cache (a tiny fast memory that stores ready-to-run instructions). While the floating-point unit works, it usually takes about 3 to 5 cycles to finish each operation. This wait time tells us how well a CPU manages backend delays.
Branch prediction is also a part of the test. It uses a branch target buffer (BTB, which quickly remembers branch results) to handle simple branch tasks. Older CPUs might find this tougher, but newer ones do it with ease. A streamlined front-end and an efficient micro-op cache help the test run smoothly.
Remember, no single benchmark covers every aspect of real-world performance. The FP32 SSE test offers helpful insights but only shows one slice of a CPU's overall ability. For a complete view, other tests are needed.
Comparing CPU-Z Benchmark vs Other Tools

When you compare benchmarking tools, you get a clear picture of how your CPU behaves under different conditions. It guides you to the test that best fits your daily tasks. CPU-Z runs a controlled FP32 math test (a test that measures your CPU's handling of floating-point math) focused on branch prediction. Other tests capture real-world slowdowns better.
Take Cinebench 2024 for example. It checks tasks that depend on memory by using larger data sets to show how delays (latency) affect performance. For gamers or those working with multimedia, these tests are often more relevant. While CPU-Z aligns well with tasks that depend on instructions per cycle (the number of commands processed each tick), it might underplay memory delays common in everyday applications.
- CPU-Z pro: Delivers steady FP32 math performance.
- CPU-Z con: Lacks detail on vector math and memory delays.
- Cinebench pro: Mimics real-world application workloads.
- Cinebench con: Requires more system resources.
- Cross-platform tools: Provide a broader range of data across systems.
- Note: Multiple test runs are needed to smooth out variations.
Think about what you really need. If you're after a detailed look at specific math tasks and branch prediction, CPU-Z is a solid choice. But if you care more about gaming or multimedia performance, tests like Cinebench might give you a deeper insight. For a well-rounded view, using both CPU-Z and memory-focused benchmarks can show a fuller picture of your CPU's capabilities.
Optimizing System for Accurate CPU-Z Benchmarking
Your CPU-Z scores depend a lot on temperature and system stability. When the CPU heats up too much, it can slow down during the FP32 test, which drops your score. Keeping a stable clock speed and good cooling helps your processor run at its best. We recommend checking temperatures with HWMonitor alongside CPU-Z so you know if things are running too hot.
- Update your BIOS and chipset drivers to keep clock speeds consistent.
- Set the Windows power profile to High Performance.
- Use HWMonitor to make sure temperatures stay under 80 °C.
- Clean dust from your heatsink or reseat your thermal paste for improved cooling.
- Disable any background apps and virtualization features to cut down on extra load.
Try running your tests on a clean boot. Also, check that your air or liquid cooling is working correctly to prevent thermal throttling. Running the benchmark several times helps smooth out any differences caused by background tasks or temperature changes. This practical method gives you a clear picture of your CPU's capability and helps you get the most reliable results.
Troubleshooting Common CPU-Z Benchmark Issues

Sometimes CPU-Z tests show odd numbers because your system's settings or files are interfering. This usually happens when the hardware and software don't play well together. Factors like CPU throttling (when your processor slows down to prevent overheating), old libraries, or file conflicts can lower the scores. The good news is these issues are easy to fix.
- Missing VC++ Redistributable: Download and install the newest version from Microsoft.
- Benchmark stuck at 0%: Run CPU-Z as administrator to bypass permission issues.
- Scores way lower than expected: Make sure your CPU isn’t being limited by power settings or heat.
- Submission errors: Check your internet connection and try again in a few minutes.
If problems still show up, head over to the CPU-Z forum. The community often shares fixes that tackle rare issues like driver conflicts or missing system files. This way, you can get your system set up right for accurate and repeatable results.
Advanced CPU-Z Benchmark Features

Validating and Sharing CPU-Z Reports
When you run CPU-Z, it does more than just benchmark. It helps you create a full online report of your hardware. After the test, a prompt guides you to generate a unique URL with your PC's complete details. This URL works like a snapshot. Need help with system issues or planning an upgrade? Sharing this link makes it easy for tech support or friends to see your system specs and diagnose any problems quickly.
Exploring the Tools Dropdown
CPU-Z doesn’t stop at basic benchmarks. The Tools menu gives you extra features for a deeper look at your hardware. One tool is a CPU stress test that pushes your processor to its limits, letting you see its thermal and power boundaries. There are also utilities to check how your CPU cooler is detected and to read your memory SPD data (detailed info about your memory modules). If you’re a developer or a power user, you'll like that you can run CPU-Z in portable mode or use an MSI installer for work setups. Trying the portable version? It lets you run tests in the field without installing anything, which is handy for quick checks and on-the-go diagnostics.
Final Words
In the action, we watched how to install and run a cpu z benchmark test, from downloading the installer to submitting your scores online. We broke down the interface, explained what each tab delivers, and showed you how our test methods work. We compared results with other tools, offered system optimization tips, and shared fixes for common issues. The insights aim to empower you to understand your hardware better. Enjoy the clarity and let your numbers guide you to smarter tech choices.
FAQ
What does CPU-Z benchmark online offer?
The CPU-Z benchmark online offers a platform for submitting and comparing CPU scores. It logs hardware details and displays single-core and multi-core performance results, making it easy for users to compare real-world test records.
How do I download and install the CPU-Z benchmark software?
The CPU-Z benchmark software is available from the CPUID website. Download the latest installer, run it as administrator, and follow the on-screen steps, including hardware validation before running tests.
What information does the CPU-Z benchmark list provide?
The CPU-Z benchmark list shows the submitted performance scores from different CPUs. It lets users compare single-core and multi-core FP32 math test results alongside hardware details shared by the community.
What do the CPU-Z benchmark scores for models like 9800X3D, 9950x3d, and 5700x3d indicate?
The benchmark scores for models like 9800X3D, 9950x3d, and 5700x3d indicate each CPU’s efficiency in FP32 math tests. They reflect differences in core performance and IPC efficiency, offering a quick comparison of processing power.
Does CPU-Z include a benchmark feature and what does it do?
CPU-Z includes a benchmark feature that runs FP32 math tests, offering both single-core and multi-core performance scores. It helps users evaluate their CPU’s processing efficiency under controlled conditions.
How accurate is the CPU-Z benchmark for measuring performance?
The CPU-Z benchmark accurately measures FP32 computational performance and branch prediction efficiency. While it provides consistent test results, it may not fully mirror all real-world tasks or multimedia workloads.
Is it safe to use CPU-Z for system validation and benchmarking?
CPU-Z is safe to use and well-regarded in the hardware community. It performs non-intrusive tests, gathers hardware details, and has a long-standing history of reliable performance without compromising system integrity.
What does CPU-Z actually do beyond benchmarking?
CPU-Z gathers detailed system information, including CPU, cache, mainboard, memory, and graphics specs. It validates your hardware during startup and offers performance tests to help users understand their device’s processing capabilities.